Explore Quickstart
Explore Overview
Any metric or dimension in your Druid dataset is available for your Explore dashboards. In Explore, you can create a data source that divides those fields into any subset, transformation (via calculations, lookups, formatting), or re-ordering depending on your dashboard needs.
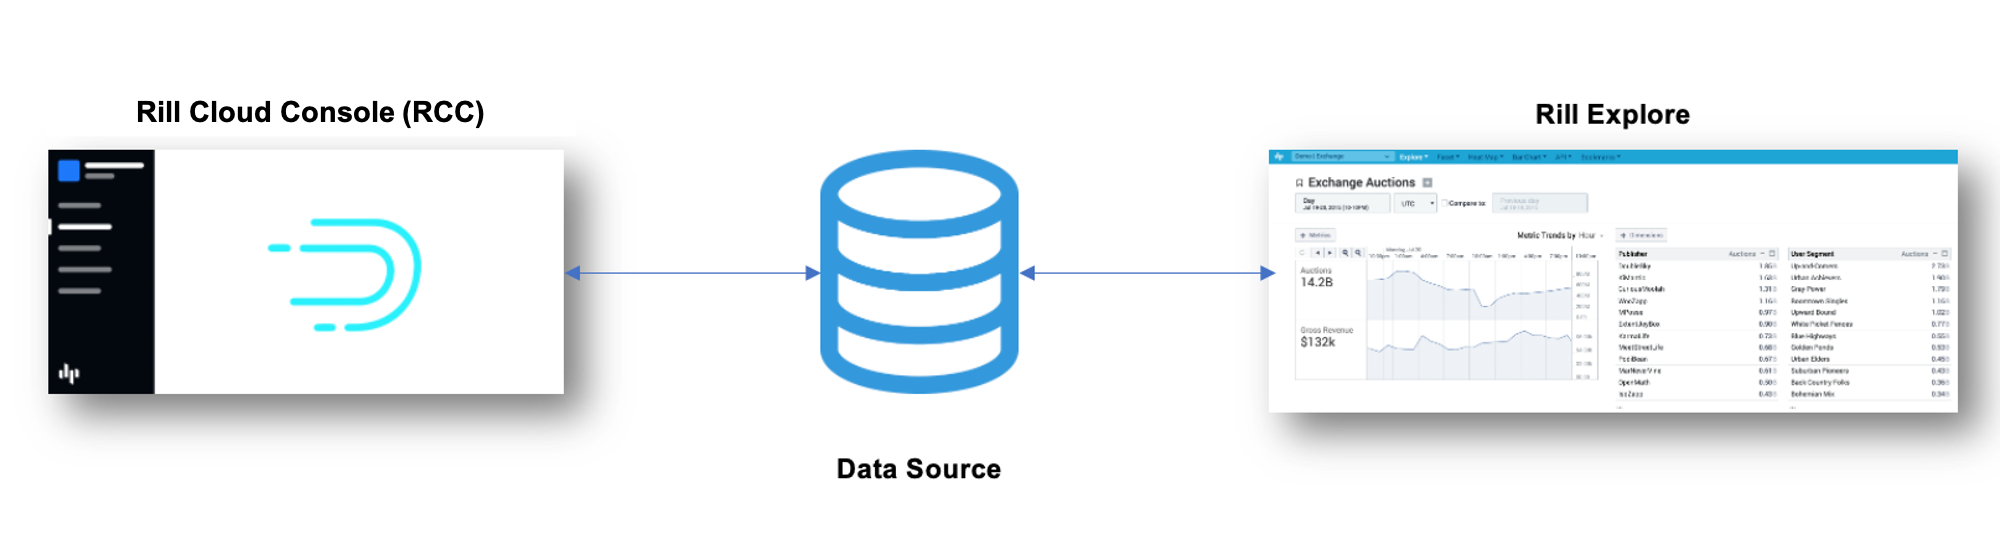
By default, Rill creates a Staging dashboard which includes all Dimensions and Metrics in your data source which is then editable or can be leveraged to create customized views.",
Basic Analysis & Navigation
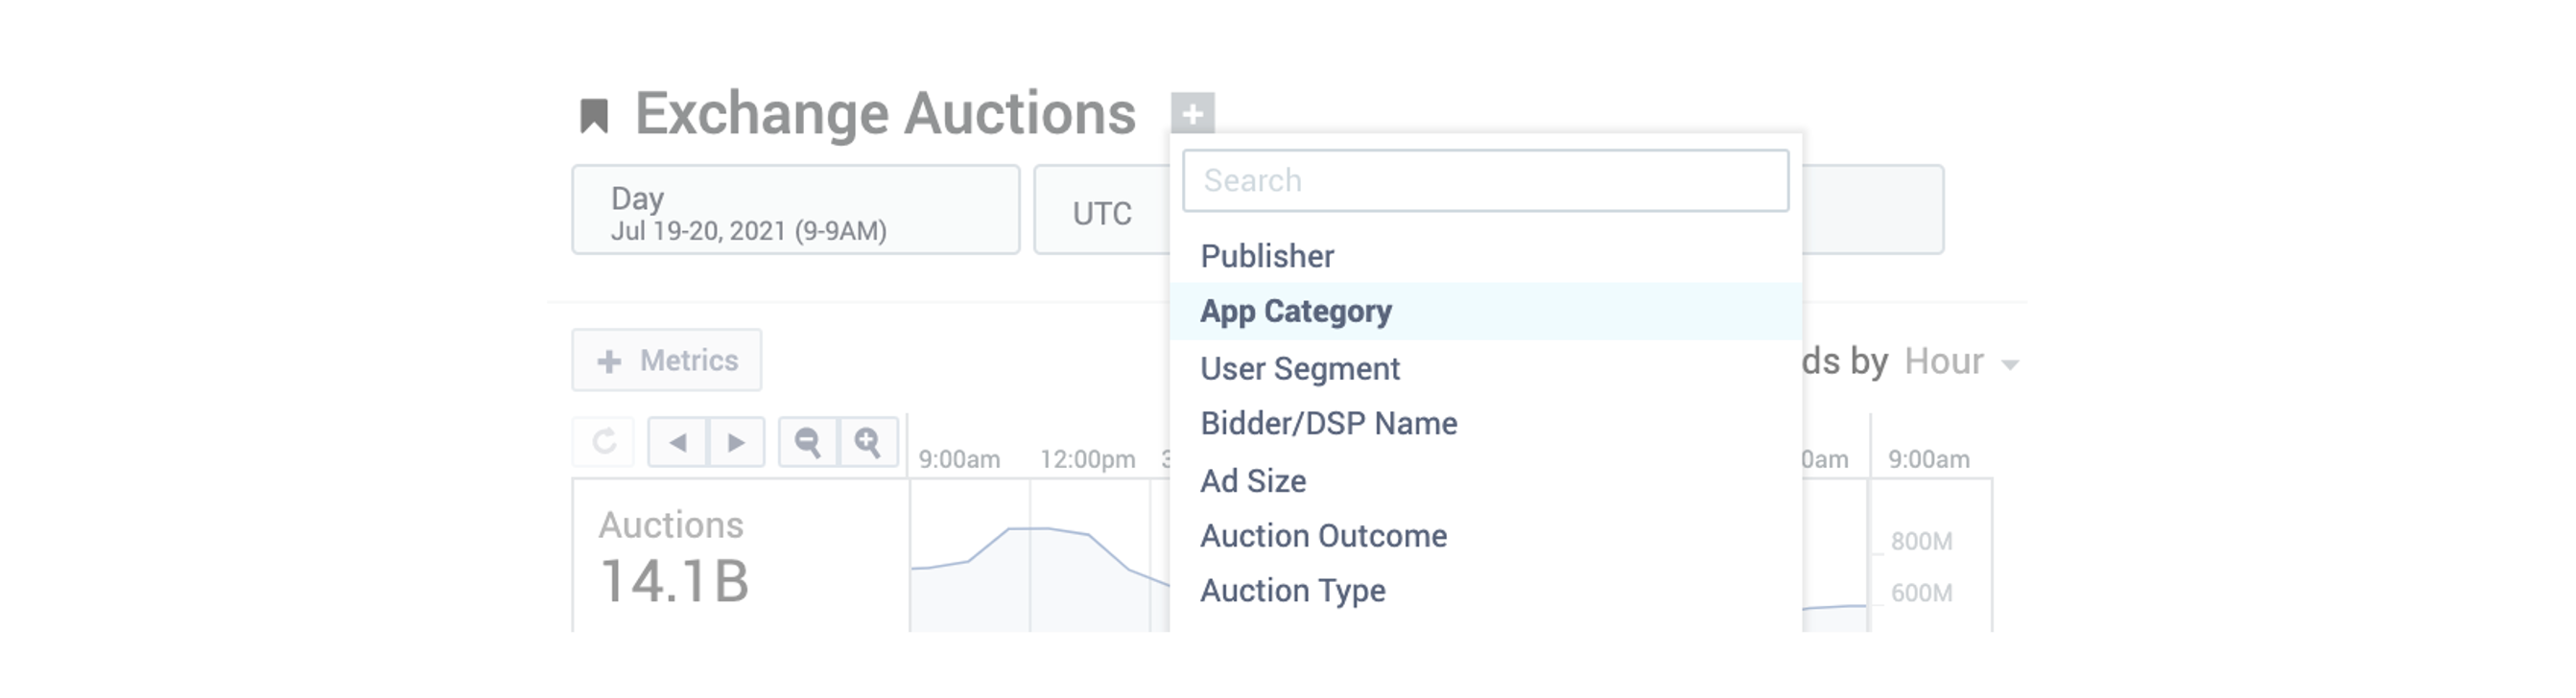
Metrics & Dimensions
Metrics are any numerical value you have provided in your data (e.g. sales, impressions, eCPM, etc.). Dimensions are the lists of fields categorizing that data (e.g. DMA, publisher, account owner, etc.).
Dashboards provide the ability to:
- Add/remove metrics and dimensions
- Expand dimensions to see full list of data
- Download results across metrics and dimensions
Visualizations
Metrics and dimensions can be visualized in a variety of ways including:
- topN tables
- Time series
- Bar charts
- Multi-line/bar graphs
- Pivot tables
Filtering
Throughout the Dashboard, you are able to filter data including:
- Include dimension values
- Exclude dimension values
- Intersections of multiple dimensions (pivot tables)
- Default time periods (e.g. last day, week, 30 days)
- Custom time periods (e.g. 07/12 thru 07/18, Tuesdays only)
- Adjusting timezones to troubleshoot global customer questions
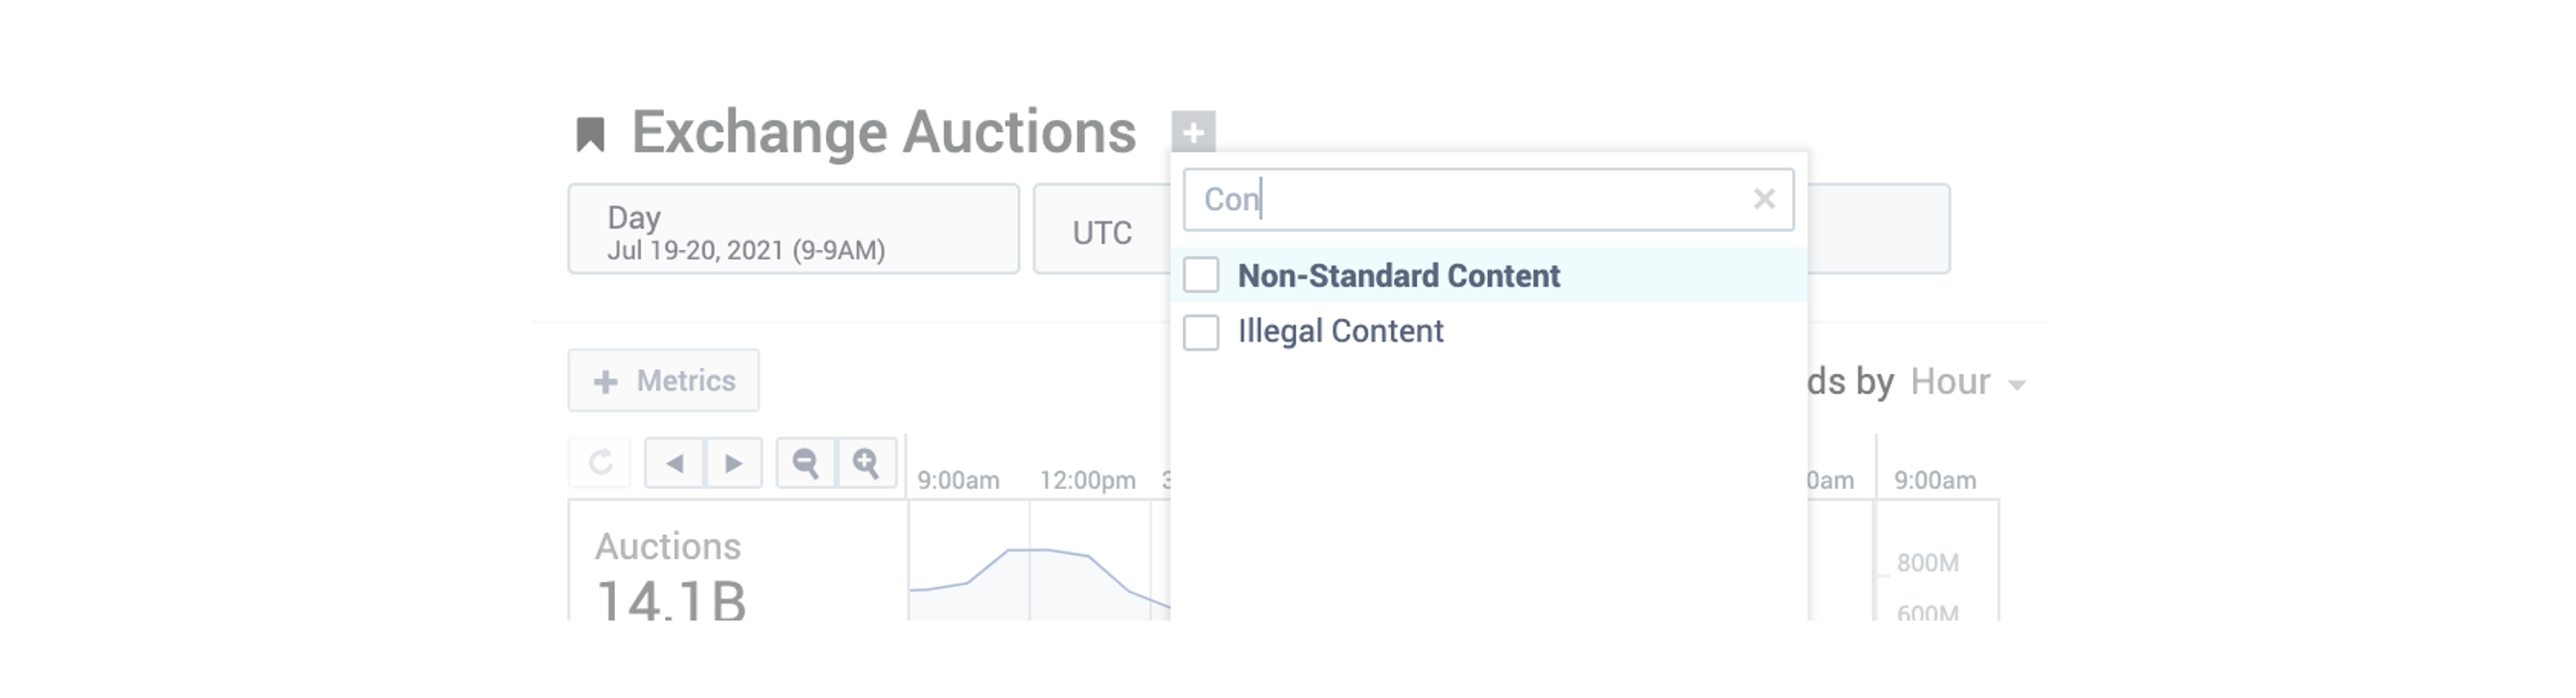
To filter dimension values, select the + next to the dashboard title or filter within a dimension table. You can search the list of dimension values to find a specific value if it does not appear in the list.
Search
Explore's search bar provides the ability to search all data for potential results and filtering. Search is useful for identifying all dimensions that contain a specific value or for quick filtering of a value in all places.
Search is the magnifying glass icon located in the top right.
 Search results cover all dimensions and return values across all dimensions or selected dimensions.

Chart Comparisons
Dashboards provide the ability to compare dimensions to each other and across time to identify outliers and insights:
- Compare metrics to prior periods - either summary or by time series
- Compare dimension trend lines (select multiple dimensions and compare results)
- Compare share of dimensions (multi-bar charts)
Example Navigation Video
The example video below includes basic time and dimension filtering along with navigating comparison charts and drilling down into data further.
Capabilities Overview
Explore provides a variety of capabilities to improve your time to insight.
The list below is a subset of the most common features for improved analysis and reporting: